


Debt Service Coverage Ratio by Property Type: What DSCR Benchmarks Mean for Investors
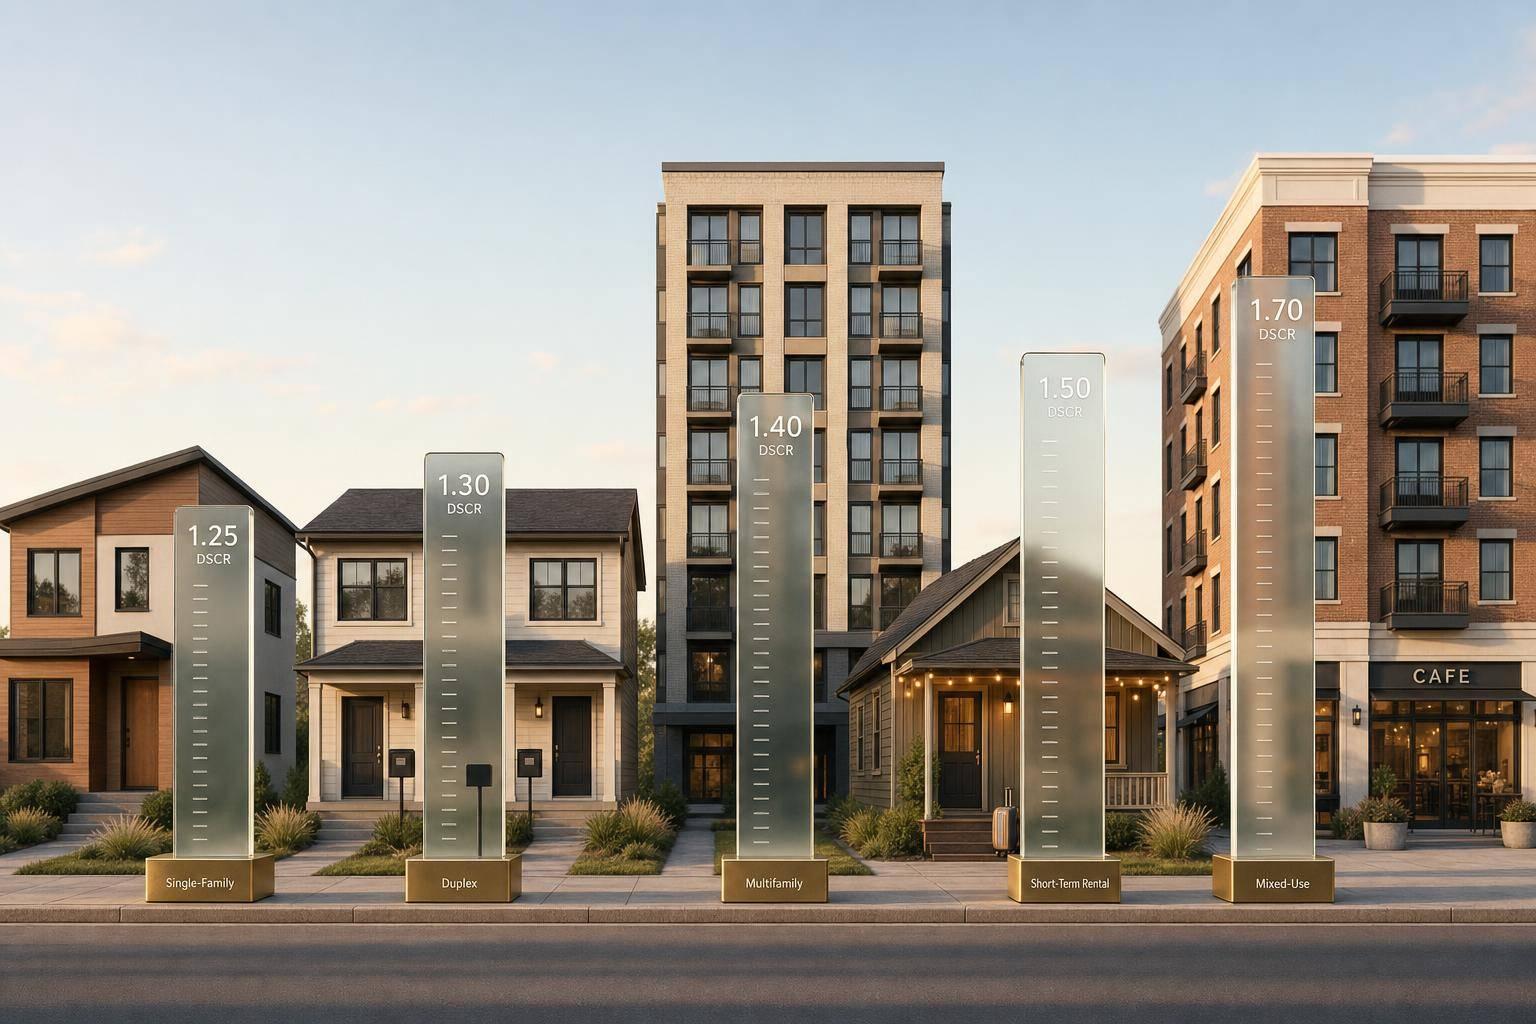
If you want the short answer, here it is: 1.25x is the line many investors should watch first. It often marks the point where loan pricing gets better, leverage improves, and approval gets easier. But that same 1.25x does not mean the same thing for every property type.
Here’s the simple takeaway:
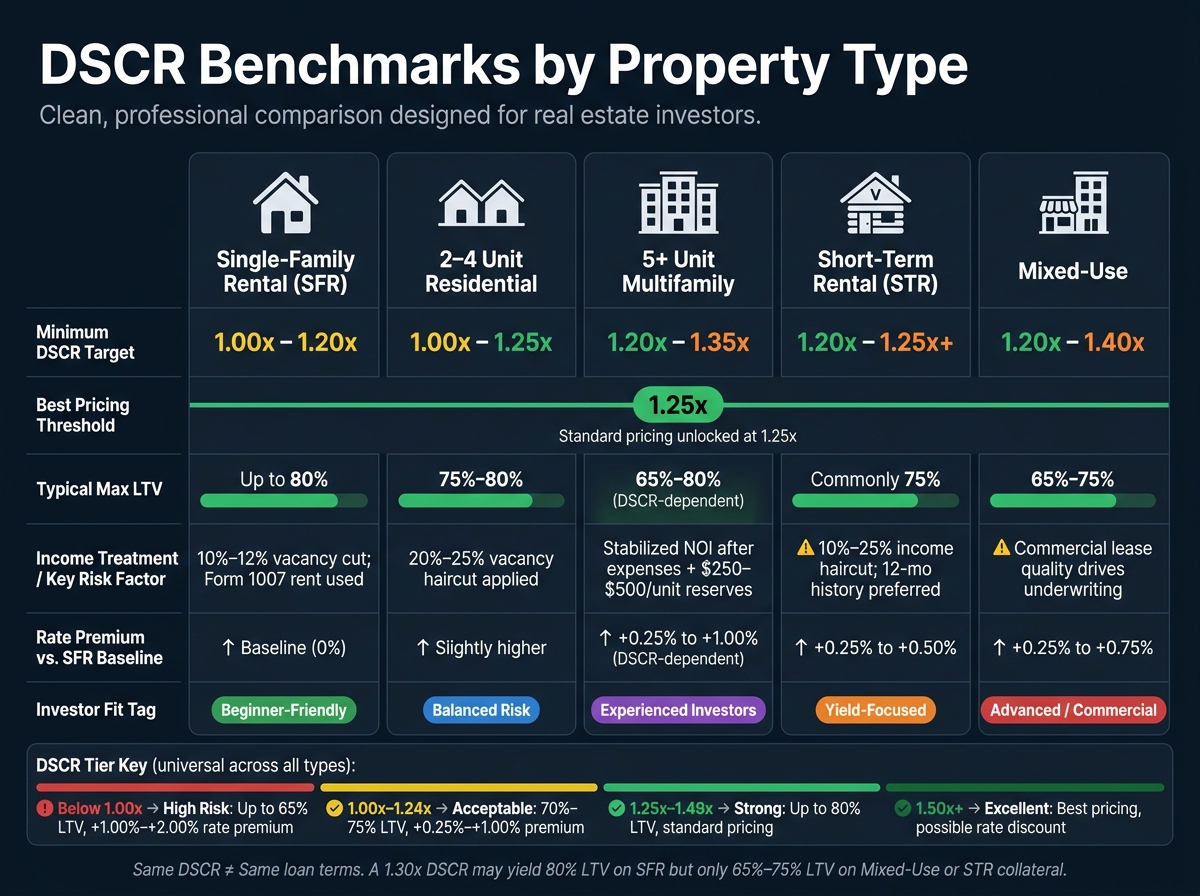
- Single-family rentals usually have the lowest DSCR bar, often 1.00x to 1.20x
- 2–4 unit properties often face tougher rent cuts and stricter underwriting
- 5+ unit multifamily is underwritten more like a commercial deal, with focus on stabilized NOI
- Short-term rentals often need 1.20x+ and may get a 10% to 25% income haircut
- Mixed-use properties often need 1.20x to 1.40x, with the commercial side driving risk
In plain English: the same ratio can lead to very different loan terms. A property at 1.30x DSCR might get 80% LTV as a single-family rental, but only 65% to 75% LTV as mixed-use or STR collateral.
Use this article if you want to size up deals fast, spot weak cash flow early, and see how lenders tend to view each asset type before you apply.
DSCR Benchmarks by Property Type: Rates, LTV & Income Rules
DSCR Loan Requirements: What Lenders ACTUALLY Check
sbb-itb-e7c549b
Quick Comparison
| Property Type | Common DSCR Target | What Lenders Focus On | Typical Leverage View |
|---|---|---|---|
| Single-Family Rental | 1.00x–1.25x+ | Rent coverage and basic property cash flow | Often highest leverage |
| 2–4 Unit | 1.00x–1.25x+ | Rent with larger vacancy cuts | Slightly tighter than SFR |
| 5+ Unit Multifamily | 1.20x–1.35x | Stabilized NOI, expenses, reserves | Loan size often capped by DSCR |
| Short-Term Rental | 1.20x–1.25x+ | Seasonality, booking history, income haircut | Often capped near 75% LTV |
| Mixed-Use | 1.20x–1.40x | Commercial lease strength and tenant quality | Often 65%–75% LTV |
If I were screening deals fast, I’d treat 1.25x as the first pass, then adjust for property type, rent treatment, taxes, insurance, and lease risk.
1. Single-Family Rentals
Single-family rentals are the starting point for DSCR lending. Most DSCR loans begin around 1.00 to 1.20, and once you hit 1.25+, you can often get better pricing and more leverage.
That number matters a lot. It affects both your interest rate and how much a lender is willing to lend.
A DSCR of 0.98 tells the lender the property doesn't fully cover its debt service. If the loan gets approved, you’ll usually see a rate premium of 100 to 200 basis points and an LTV cap near 65%. A DSCR of 1.08 is still tight. In most cases, that means a rate increase of 0.50% to 1.00% and an LTV in the 70% to 75% range. Get to 1.23, and you're getting close to the 1.25 mark. That can support 75% to 80% LTV with standard pricing.
| DSCR | Lender View | Max LTV | Pricing Impact |
|---|---|---|---|
| 0.98 | Below break-even | 65% | +1.00% to +2.00% premium |
| 1.08 | Marginal | 70%–75% | +0.50% to +1.00% premium |
| 1.23 | Strong | 75%–80% | Standard pricing |
Even with SFRs, the final number can shift during underwriting. Your own DSCR calculation may come in 0.10 to 0.20 higher than the lender’s. Why? Because lenders usually rely on the appraiser’s Form 1007 rent estimate, apply a 10% to 12% vacancy factor, and update taxes and insurance to current amounts.
If a deal is close, two moves can help:
- Put more money down. That cuts the loan amount and lowers monthly debt service.
- Use interest-only terms. Since the payment doesn’t include principal, the DSCR can improve by 0.10 to 0.15, which may push the deal into a better pricing tier.
From here, 2–4 unit properties use the same DSCR formula, but the income mix and underwriting profile start to change.
2. 2–4 Unit Properties
Duplexes, triplexes, and fourplexes are usually underwritten more conservatively than single-family rentals. In plain English, lenders take a bigger haircut on rent.
A common example is the 20% to 25% vacancy factor applied to gross rental income. So if your fourplex brings in $5,200 per month in gross rent, the lender may only count about $3,900 to $4,160 as qualifying income. As the property gets larger, that conservative approach matters more.
For investors, the main issue is simple: does the extra unit count make up for the stricter vacancy haircut through better cash flow? Sometimes yes. But lenders don't just look at more doors and assume less risk.
Multiple units can help support a stronger DSCR because the income doesn't depend on just one tenant. If one unit goes vacant, the whole property doesn't stop producing rent. But lenders balance that out by baking in more management and vacancy risk.
Most lenders look for a minimum DSCR somewhere between 1.0 and 1.25. And 1.25 is the main pricing breakpoint. Hit that mark, and your loan terms usually look better. Fall below it, and the deal can get more expensive fast.
Lenders use Fannie Mae Form 1025 for 2–4 unit properties. They count the lower of actual rent or appraised market rent. That means market rent often becomes the key DSCR input, especially when vacancies are in play.
| DSCR Range | Lender View | Max LTV | Rate Impact |
|---|---|---|---|
| 1.50+ | Excellent | Up to 80% | Best pricing; possible discount |
| 1.25–1.49 | Strong | 75–80% | Standard pricing |
| 1.00–1.24 | Acceptable | 70–75% | Higher pricing; usually 25–30% down |
| Below 1.00 | High risk | Up to 65% | Below 1.0, pricing usually rises sharply |
Once a property reaches five units, lenders move it into a different underwriting category.
3. 5+ Unit Multifamily Properties
Once a property gets past five units, lenders treat it as commercial multifamily collateral. And that changes the game.
At that point, they stop leaning on gross rent and start looking much more closely at NOI. In plain English: DSCR now depends on stabilized NOI, not just top-line rental income.
For 5+ unit properties, lenders underwrite NOI after operating expenses and annual replacement reserves, which are usually $250 to $500 per unit. That tighter lens is why even small shifts in NOI can move a deal from one pricing tier to another. Compared with SFRs and 2–4 unit properties, 5+ unit loans usually need a bigger cash-flow cushion.
Most lenders want a DSCR of 1.20 to 1.25 for stabilized 5+ unit properties, and many programs now center on 1.25. Commercial banks and portfolio lenders often want more room, usually around 1.25 to 1.35.
On these deals, DSCR often becomes the main limit on loan size. Strong NOI can support more leverage. Weak DSCR can lead to a smaller loan, even if the LTV on the term sheet looks fine. That’s why lenders often price 5+ unit loans in DSCR bands, not just by LTV.
| DSCR Range | Lender View | Typical Leverage | Pricing Impact |
|---|---|---|---|
| 1.50+ | Excellent | Up to 80% LTV | Best pricing (-0.25% to -0.50%) |
| 1.25–1.49 | Strong | Up to 80% LTV | Standard pricing |
| 1.10–1.24 | Acceptable | Up to 75% LTV | +0.25% to +0.50% |
| 1.00–1.09 | Marginal | Up to 70% LTV | +0.50% to +1.00% |
| Below 1.00 | Limited options | Up to 65% LTV | +1.00% to +2.00% |
On larger deals, even a modest bump in NOI can lead to much better leverage. One detail trips people up all the time: use projected post-purchase property taxes, not the seller’s current tax bill. If the property gets reassessed, DSCR can fall below the lender’s required level.
4. Short-Term Rentals
Short-term rentals usually underwrite tighter than long-term rentals. The reason is simple: the income can swing a lot more from month to month.
Most 2026 programs start at 1.20x DSCR. If you hit 1.25x or more, pricing and leverage often get better. At 1.50x or more, lenders usually see the deal as strong. So the income test matters more than the big headline rent number.
The main issue is how much of that income the lender will count. Most lenders don't just accept projected STR revenue as-is. Instead, they apply a 10% to 25% income discount to account for seasonality and booking swings. If the property has less than 12 months of booking history, that haircut often goes up to 25% on projections. Lenders that can underwrite from a full 12-month actual income history usually treat that history as less risky than third-party estimates. And that has a direct effect on DSCR: lower counted income means lower DSCR, even when gross bookings look strong.
That's the tradeoff with STR financing. You get access to income that a long-term lease may never reach, but the lender gives that income less weight because it can change fast. Common STR terms include a 75% LTV cap, 0.25% to 0.50% higher rates, and a 700 credit-score floor. Insurance can also jump enough to drag DSCR below the 1.20x minimum before closing.
Here is how STR terms compare with long-term rental benchmarks.
| Factor | Long-Term Rental (LTR) | Short-Term Rental (STR) |
|---|---|---|
| Typical Min DSCR | 1.00x–1.15x | 1.20x or higher |
| Strong DSCR Range | 1.20x+ | 1.25x+ |
| Max LTV | Up to 80% | Commonly 75% |
| Income Recognition | 100% of gross rent | 75%–90% of projected revenue |
| Pricing | Standard | 0.25% to 0.50% premium |
Mixed-use properties are harder to underwrite because lenders split the income streams and may apply DSCR in different ways to each one.
5. Mixed-Use Investment Properties
Mixed-use properties sit in their own bucket because lenders weigh the residential and commercial parts of the deal in different ways. In most cases, they use the riskiest piece of the property as the benchmark. That’s usually the commercial income stream, since it tends to be less predictable than residential rent. As a result, DSCR minimums are often higher than they are for most residential investment properties. For investors, that benchmark is a simple gut check: it shows how much uncertainty the lender is willing to accept on the commercial side of the property.
In 2026, mixed-use properties usually need a DSCR of 1.20x to 1.25x. Retail-heavy deals often need 1.30x to 1.40x, and even stabilized assets have seen minimums move up as taxes and insurance costs climb.
Lease quality matters a lot here. Lenders may discount commercial rent if the tenant looks weak or the lease is short-term. Month-to-month commercial leases are often left out of NOI altogether, and lenders usually want to see 2 to 3 years left on a written lease. A personal guaranty from the business owner can also help the loan file look stronger.
Mixed-use deals usually come in at 65% to 75% LTV, with 2026 rates often running 7.75% to 9.75%. That’s about 0.25% to 0.75% above a similar single-family rental DSCR loan. If the ratio falls between 1.00x and 1.24x, lenders may add 0.125% to 0.375% to the rate. A weaker DSCR can also lead to lower LTV. On the other hand, stronger deals at 1.50x or above may qualify for better terms and lower down payment requirements.
If the DSCR still comes in short, one common fix is a longer amortization period. That lowers annual debt service and can improve DSCR without asking for higher rent. Some lenders also look at Global DSCR, which adds personal income or other business revenue when the property’s standalone ratio is tight. And if a mixed-use deal only works with a thin DSCR, it’s worth putting it side by side with a cleaner residential or multifamily asset before moving ahead.
How to Compare Deals Using DSCR Ranges
Before you talk to a lender, use DSCR as a quick filter to see if a deal is even worth your time. A 1.25x target is a good starting point. From there, you can estimate the debt service and the loan size the property can support. It’s a simple first-pass check for comparing properties before you get into full loan modeling.
That said, lenders usually look at deals with a stricter lens than investors do. They may cut projected rent, reset property taxes, and discount shaky income sources before they size the loan.
And here’s where it gets interesting: the same DSCR doesn’t always lead to the same leverage. Property type plays a big role. A single-family rental and a mixed-use deal might post similar ratios on paper, but the lender may treat them very differently.
| Property Type | Projected NOI | Annual Debt Service | DSCR | Likely Lender View | Loan Term Implications |
|---|---|---|---|---|---|
| SFR (Memphis) | $19,800 | $15,000 | 1.32x | Preferred | 80% LTV; Lowest rates |
| 2–4 Unit (Kansas City) | $39,600 | $30,240 | 1.31x | Standard | 75% LTV; Standard rates |
| 5+ Unit Multifamily | $26,400 | $26,400 | 1.00x | Marginal | 70–75% LTV; +0.50% rate premium |
| STR (Airbnb)* | $48,000 | $36,000 | 1.33x | Acceptable | 70–75% LTV; 20% income haircut applied |
| Mixed-Use** | $42,000 | $32,400 | 1.29x | Conservative | 65–70% LTV; Residential income only |
*After 20% haircut on $60,000 gross STR income. **Mixed-use loans often underwrite the commercial side more conservatively, which can suppress leverage even when the headline DSCR looks strong.
Short-term rental and mixed-use deals are a good example. They can clear 1.25x on paper and still come back with lower leverage because lenders care about income stability just as much as the ratio itself.
That’s why DSCR bands matter, not just the raw number. Those bands also affect pricing. Moving from the 1.00x–1.24x range into 1.25x+ can cut your rate by 0.25% to 0.75%. On a borderline deal, putting more money down, say moving from 20% to 25%–30%, can reduce debt service enough to push the loan into a better DSCR band.
The next step is to weigh those ratios against each property type’s risk and leverage limits.
Pros and Cons by Property Type
Once you look past the benchmark ranges, the choice usually comes down to lender fit and how much leverage you want. That’s why the same DSCR can lead to very different loan terms depending on the property type.
Use this table to line up the property type with the DSCR band, leverage, and pricing you’re aiming for.
| Property Type | DSCR-Related Advantages | DSCR-Related Drawbacks | Investor Fit |
|---|---|---|---|
| Single-Family Rental (SFR) | Lowest DSCR floors (1.0–1.20); most standardized lender options | One vacancy can erase all rent; lower cash flow ceiling per loan | Conservative investors; newer DSCR borrowers |
| 2–4 Unit Residential | Multiple units can support stronger qualifying income | Slightly higher DSCR minimums (1.15–1.25); more complex appraisals | Balanced-risk investors; cash flow seekers |
| 5+ Unit Multifamily | Stabilized NOI supports larger loans | Moves into commercial underwriting; lower leverage (65%–75% LTV); higher DSCR buffers (about 1.20–1.35) | Experienced and institutional investors |
| Short-Term Rental (STR) | High revenue can lift DSCR quickly | Income haircuts and higher down payments reduce leverage | Yield-focused investors in high-demand tourist markets |
| Mixed-Use | Diversified income from residential and commercial tenants | Limited lender pool; commercial space drives underwriting | Experienced investors comfortable with commercial underwriting |
In plain English, SFRs and 2–4 unit properties are usually the easiest way in. They tend to offer simpler loan paths and more room for newer borrowers. Multifamily, STRs, and mixed-use can pay off in a bigger way, but lenders usually want stronger cash flow and tighter underwriting.
The next section is where this gets more practical: comparing actual deals against these ranges before you start underwriting.
Conclusion
No single DSCR works for every property type. A ratio that makes sense for a single-family rental can miss the mark for a short-term rental or a mixed-use deal. Lenders use different benchmarks because income stability, vacancy risk, and lease quality change from one asset class to another.
That makes the comparison step pretty simple. Screen each deal against the benchmark range for its property type, with 1.25x serving as the common threshold for standard pricing and stronger leverage. A move from the low 1.20s to 1.25x can improve pricing and reserve treatment. If a deal lands just under a tier cutoff, a larger down payment may be enough to change the result.
The upside is simple: you get a faster way to sort strong deals from weak ones. For investors, the key is to match the DSCR target to the asset’s cash-flow profile before structuring the loan.
FAQs
How do lenders calculate DSCR?
Lenders usually calculate DSCR in one of two ways, so it’s smart to check which method your lender uses.
For many residential rentals, the formula is monthly gross rent / monthly PITIA. Other lenders use NOI / annual debt service.
PITIA includes:
- Principal
- Interest
- Taxes
- Insurance
- HOA dues
Rental income is often based on the lower of the lease amount or market rent. That means the same property can show a different DSCR depending on the numbers and method the lender uses.
Why can my DSCR differ from the lender’s?
Your DSCR might not match the lender’s. And the gap often comes down to how they count income and debt.
Many lenders use PITIA: principal, interest, taxes, insurance, and HOA dues. So if you leave out taxes, insurance, or HOA fees, your DSCR can look higher than what the lender shows.
They may also plug in different rent and tax numbers. For example, some lenders use the lower of lease rent or market rent. Others base property taxes on a reassessment tied to the new purchase price, which can push the payment higher.
On top of that, some lenders use different formulas altogether. That can shift the DSCR by 0.10x to 0.20x.
Can I improve DSCR before applying?
Yes. You may be able to improve your DSCR before you apply by increasing property income, cutting operating expenses, or lowering monthly debt payments.
You can also put more money down, which may reduce your principal and interest payments. It also helps to confirm how the lender calculates DSCR, because methods can vary. In some cases, choosing a different loan structure can help too. For example, an interest-only period may lead to a stronger ratio.


