


Organic traffic benchmarks for top lending websites 2026

Organic traffic benchmarks for lending websites are only useful when they compare like with like: same query type, same loan product, same 28-day window. This page gives you the benchmark framework for 2026 and states plainly where published industry averages do not hold up.
TL;DR
- No credible single average exists for organic traffic benchmarks for lending websites in 2026; benchmark against your own trend and loan-product cohorts.
- Measure by product (DSCR, fix and flip, bridge, bank statement), not by total sessions.
- Use 28-day windows compared year over year to strip out rate-cycle swings.
- Judge traffic by funded-loan intent, not visit volume. Ten qualified investors beat a thousand rate shoppers.
Why this matters
Lending traffic swings with interest rates, refinance waves and seasonality. A flat line in a rate-hike quarter can be a win. A spike during a rate drop can be noise.
Most benchmark posts publish one average across all lenders. That number blends consumer mortgage giants, credit unions, and niche investor lenders. It tells a hard-money broker nothing.
The verdict: for a lender serving real estate investors, such as LoanGuys, the only benchmark that predicts revenue is a cohort benchmark built on your own data.
The short answer
There is no verified, publicly sourced average that applies to every lending site in 2026. Any page quoting a single organic visits-per-month figure for lenders is blending incompatible business models. This page does not invent one.
What you can benchmark with confidence is direction, mix and efficiency. The table below defines each metric, the window and the comparison that makes it meaningful.
The benchmark table
Organic clicks (Google Search Console)
- Window: 28 days
- Compare against: Same 28 days last year
- What a healthy reading looks like: Growth ahead of the rate-driven market trend
Non-branded click share
- Window: 28 days
- Compare against: Prior 28 days
- What a healthy reading looks like: Rising share means you are winning new demand
Clicks by loan product
- Window: 90 days
- Compare against: Other products on your site
- What a healthy reading looks like: No product starved while another carries the site
Impressions to clicks (CTR) by query group
- Window: 28 days
- Compare against: Your own page-one averages
- What a healthy reading looks like: Stable or rising after title changes
Organic leads per 1,000 sessions
- Window: Quarter
- Compare against: Prior quarter
- What a healthy reading looks like: Rising even when sessions are flat
Funded loans attributed to organic
- Window: 12 months
- Compare against: Prior 12 months
- What a healthy reading looks like: The only number that pays the bills
No cell carries an industry average because none can be sourced with a date and scope. Fill the right-hand column with your own numbers from Search Console and your CRM.
High and low commentary
Product-specific pages lead. Pages built around a defined borrower and loan type, such as DSCR loans for multi-unit rental properties, pull qualified investors because the query already states the use case.
Generic rate and calculator pages trail on lead quality. They collect volume from shoppers who compare dozens of lenders and rarely convert. Volume there is the least reliable benchmark on the page.
Methodology and limits
The framework uses Google Search Console as the traffic source, a CRM or loan origination system as the lead and funding source, and fixed 28-day and 90-day windows. Third-party tools estimate traffic with wide error margins on lending queries, so treat their numbers as directional.
One named limitation: this framework gives no cross-lender ranking. You cannot learn from it whether you are ahead of a competitor, only whether you are ahead of yourself.
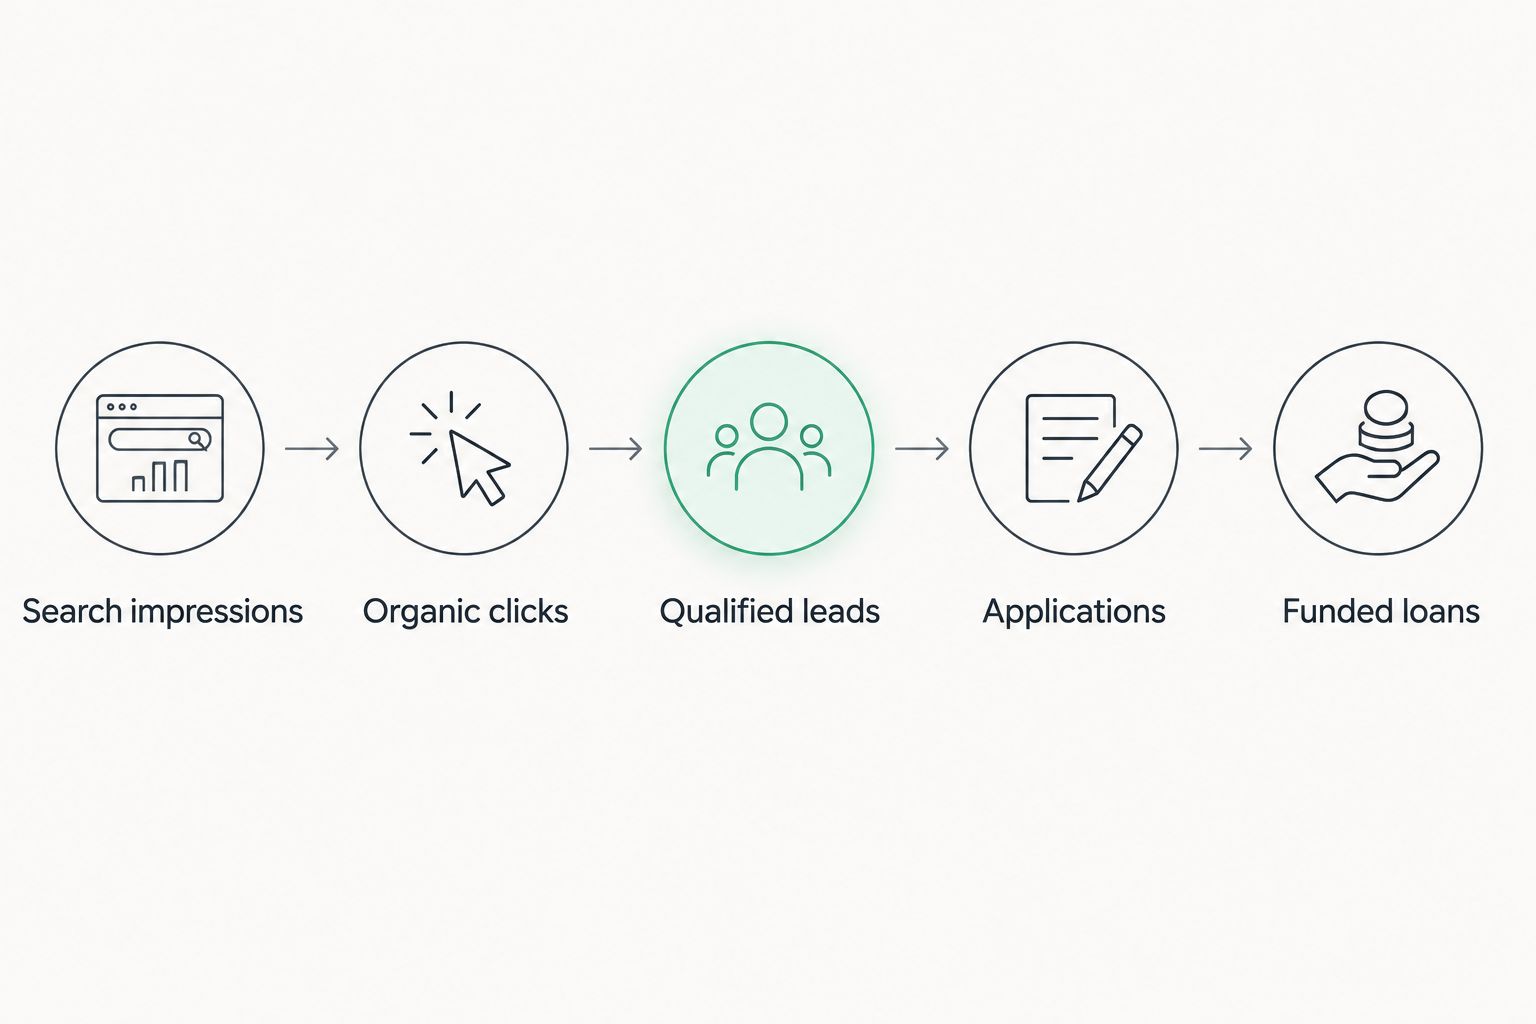
Benchmark every stage of the funnel, not only the top.
Benchmark by loan product, not by site
Split your site into product cohorts and track each on its own. For an investor lender, that usually means:
- DSCR loans: query demand follows rental-market activity and investor sentiment.
- Fix and flip: demand is project-driven and spikes when inventory opens up.
- Bridge loans: short, urgent searches with high intent and low volume.
- Bank statement loans: steady demand from self-employed borrowers, tied to profession-specific queries.
A cohort that loses clicks while the others grow is a content or ranking problem. A cohort that moves with the whole market is a demand problem you cannot fix with SEO.
Read traffic next to cost
Organic traffic has a paid mirror. Compare the clicks you earn with what the same intent costs to buy. The breakdown in average CPC for real estate investor loan keywords shows why high-intent lending queries are worth defending organically.
How to use these benchmarks
- Set a baseline this week. Export the last 90 days of Search Console data by page, then group pages by loan product.
- Track year over year. Compare each 28-day window to the same window in 2025 so rate cycles do not distort your read.
- Tie traffic to leads. If sessions rise and leads per session fall, you are attracting the wrong queries. Cut or rewrite the pages causing it.
- Compare with lender alternatives only on intent. When you benchmark against competitors, compare positions on the same queries, as in best DSCR loan lenders, not total traffic estimates.
Talk to LoanGuys about your loan
DSCR, fix and flip, bridge and bank statement programs for investors.
FAQ
What is a good organic traffic benchmark for a lending website in 2026?
The most reliable benchmark is your own year-over-year trend per loan product. A single industry average blends consumer lenders and niche investor lenders, so it misleads more than it helps.
Should I benchmark total sessions or leads?
Benchmark leads and funded loans first. Sessions are a leading indicator only when the queries match borrowers who can qualify.
How often should I review lending site traffic?
Review every 28 days against the same window last year. Add a quarterly review of leads per 1,000 sessions.
Are third-party traffic estimates accurate for lenders?
They are directional only. Lending queries are volatile and estimates carry wide error, so Search Console is the source of record.
Does branded traffic count as an organic benchmark?
Track it separately. Branded clicks reflect awareness, while non-branded clicks show whether your content wins new demand.
How do rate changes affect organic traffic for lenders?
Rate drops lift refinance and purchase queries across the whole market. Compare your growth with the market direction before crediting SEO.
One last thing
The best benchmark in lending is the ratio of funded loans to organic sessions. If you only add one column to your 2026 report, add that one.


